







Code Debugger
Detect and resolve coding issues using AI assistance
 gpt-4o-mini


Your prompt will appear here…
Your beautifully formatted article will appear here once you generate.
No history yet
Your generations will appear here. Sign in to save them permanently.
A few months ago I lost most of an afternoon to a Laravel error that I had seen before, fixed before, and could not for the life of me find again in the codebase. The mistake was three lines above where the stack trace pointed. The AI Code Debugger on EizTools would have spotted it in under a minute. I now use the tool for almost every error I cannot solve in two minutes by eye, and that one habit has changed how long my working day actually feels. The same has been true for everyone on my team. The lost afternoons have stopped, and we now ship features in the time we used to spend chasing the wrong line of code.
I am Sabir Bepari, founder of EizTools. Below is the way I have come to think about debugging, and what the tool does well that human eyes consistently miss across every language and every framework I have shipped code in.
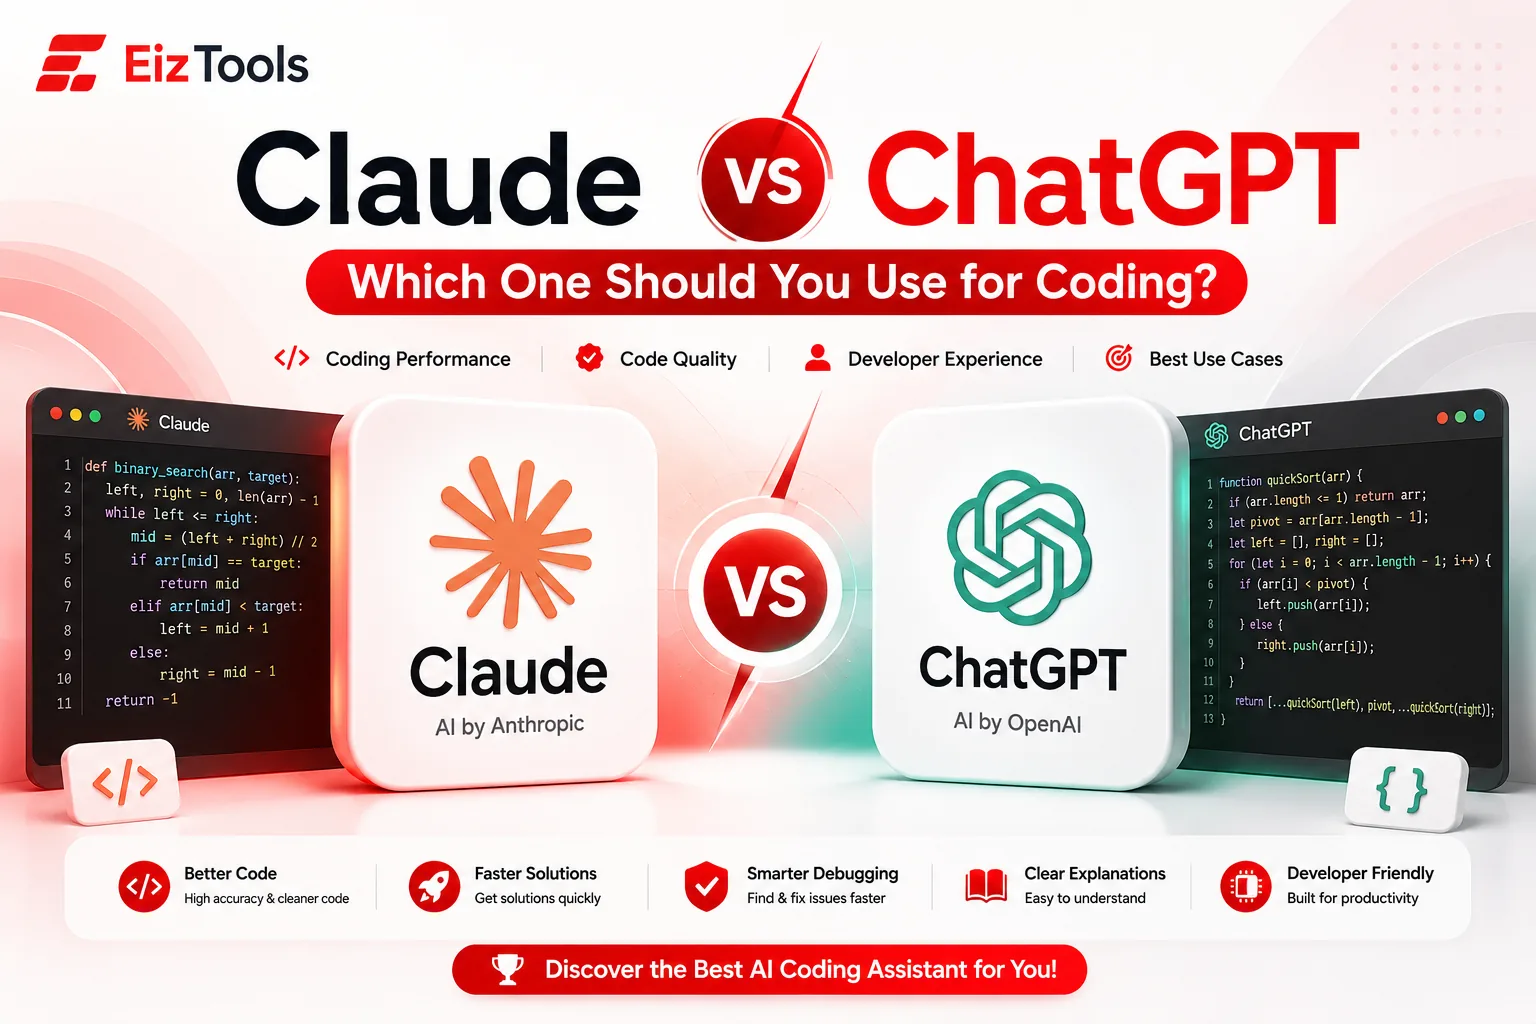
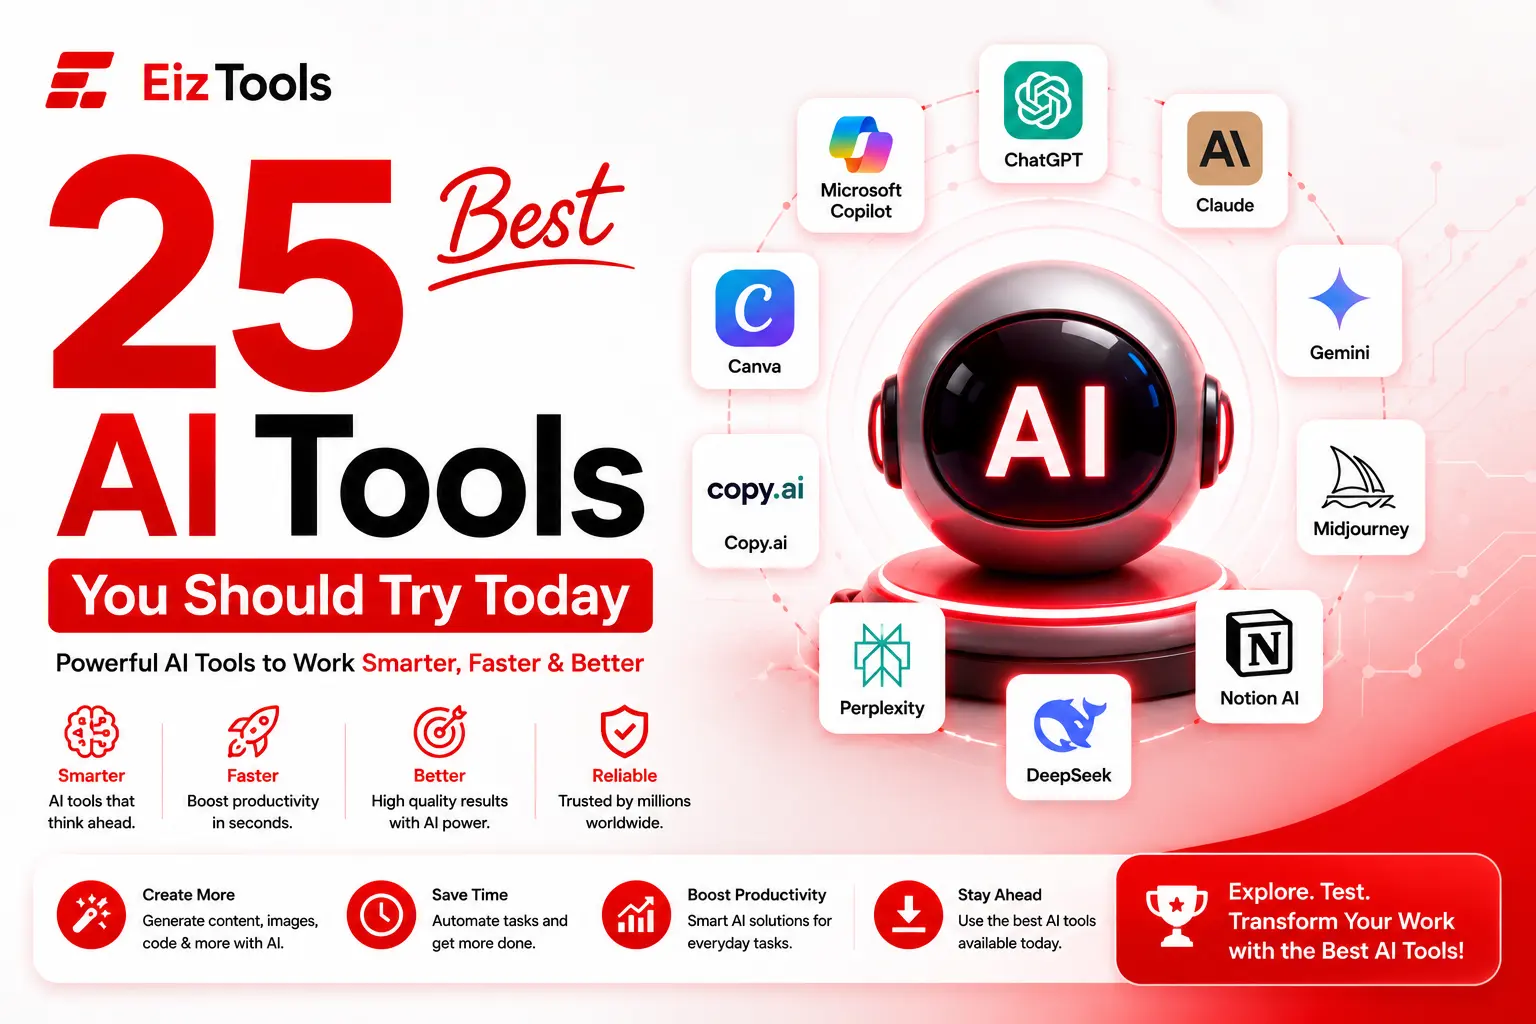
Quick Answer: The AI Code Debugger is a free EizTools tool that identifies and explains bugs in code. You set the programming language, framework, debugging focus, explanation style, and output format, then get a diagnosis and fix using models such as ChatGPT, Gemini, Claude, DeepSeek, Grok, and Qwen.
The Bug You Cannot See in Your Own Code
The reason your own bug stays invisible for so long is the same reason your own typos stay invisible. Your brain reads the version you meant to write, not the version on the screen. After fifteen minutes of staring, every line looks correct because you know what each one was supposed to do. A second pair of eyes finds it in seconds. The AI Code Debugger is that second pair of eyes, available the moment you need them, with no waiting for a colleague to be free or another team to respond to a ticket.
Where the Focus Setting in the AI Code Debugger Earns Its Keep
This is the single setting I push hardest. A focused diagnosis is the difference between a useful answer and a generic overview. Each focus aims the analysis at the kind of bug you actually suspect.
| Focus | What It Finds |
|---|---|
| Runtime Errors | Null references, type mismatches, the crash itself |
| Logic Errors | Wrong output, no exception thrown |
| Performance Issues | Slow loops, N plus one queries, blocking calls |
| Security Issues | Injection risk, unvalidated input, exposure |
| API Errors | Auth failures, endpoint mistakes, rate limits |
| Database Errors | Schema mismatches, missing indexes, query syntax |
The Capabilities You Care About
Eight Languages
PHP, JavaScript, Python, Java, C++, C#, TypeScript, and Go.
Framework Aware
Laravel, React, Vue, Next.js, Node.js, Django, Flask, and Express.
Targeted Diagnosis
Aim the analysis at the bug you actually suspect.
Explanation Styles
Beginner friendly, technical, step by step, detailed, or simplified.
Output Formats
Plain text, Markdown, step report, or developer notes.
Free Models
Premium AI engines at no cost.
How I Now Approach Stuck Code With the AI Code Debugger
Two minutes is my rule. If I cannot see the bug in two minutes, I copy the snippet, the error, and the stack trace into the AI Code Debugger and set the focus to the category I suspect. The diagnosis usually arrives faster than I can finish brewing coffee, and even when the fix is obvious in hindsight, the explanation often teaches me something I would have missed by patching alone. This is how I now learn faster as a developer than I did before the tool existed, and how my team avoids those long stuck afternoons that used to drag a whole sprint behind schedule.
What I always include : Paste the stack trace, not only the function. The trace is the most precise signal about where the failure originated, and it narrows the AI Code Debugger from speculating across a function to pointing at the exact line.
What the AI Code Debugger Will Still Ask You to Confirm
Where It Excels
- Targeted analysis by focus type
- Framework aware diagnosis
- Catches logic bugs that throw nothing
- Free across eight languages
What Still Needs You
- Test the suggested fix before deploying
- Security findings deserve a dedicated review
- Complex multi file issues may need iterating
Every bug lives in the gap between what you assumed the code would do and what it actually does. Closing that gap quickly is the whole of debugging.
Sabir Bepari, Founder of EizTools
Quick Questions on the AI Code Debugger
Is the AI Code Debugger free?
Yes, with full access to several premium AI models and no subscription, account, or card details required at any stage of the work.
Will it help juniors and seniors equally?
Yes, because the explanation style setting adapts to the reader. A junior developer gets a clear walkthrough, while a senior developer can keep it technical and fast.
Which languages does it support?
PHP, JavaScript, Python, Java, C++, C#, TypeScript, and Go, covering most of the languages used in modern web and software work.
Does it know specific frameworks?
Yes. Set Laravel, React, Vue, Next.js, Node.js, Django, Flask, or Express, and the diagnosis respects the conventions of that framework, which catches configuration and convention errors that a generic checker would miss. The framework setting is the single fastest way to sharpen the result.
What should I paste in?
The code, the error message, and the stack trace if you have it. The more context, the more precise the fix, and the faster you get back to building rather than guessing.
Can it catch logic bugs that throw no error?
Yes. Set the focus to logic errors and describe the unexpected behaviour, and it analyses intent against output rather than waiting for a crash, which is often where the hardest bugs of all actually hide.
Try the AI Code Debugger on Your Next Stuck Bug
The next time the same error has had you staring for five minutes, open the AI Code Debugger, paste the snippet and the trace, and let the second pair of eyes save your afternoon. The hours you reclaim across a month of small bugs add up to a different kind of working week.
Thank you for reading, and welcome to the EizTools community. If this helped, follow me on social media, turn on push notifications, and subscribe to our newsletter so you never miss a new tool we ship. To document the fix you just shipped, try the AI Paragraph Generator.

Sabir Bepari
Founder of EizTools and a passionate AI enthusiast dedicated to building practical, user-friendly AI tools that simplify everyday tasks.
Follow EizTools
New AI tools, practical tips and product updates — straight to your feed.